
Track sales and labour cost on the roster
Enter a sales forecast or actual sales for each day, and see the day's labour cost and labour percentage against your target right on the roster.
The roster can show each day's sales next to what you're spending on wages, so you can see whether the week you're building pays for itself. This guide covers the Daily totals row, entering sales, and reading the labour percentage.
Who this is for
Owners and managers using the Shiftly web platform to run your business.
Before you start
- Open Roster from the main navigation and pick the location at the top left.
- What you see depends on your access. Pay & labour cost lets you see labour cost. Sales figures lets you see sales, and you need edit access to it to type them in. You need both to see the labour percentage. See Sharing access.
- Each location has a Target labour percentage, the share of sales you aim to spend on wages. It starts at 30% and you can change it under the location's Breaks & Shifts settings. See Add and set up your locations.
Find the Daily totals row
The Daily totals row runs along the bottom of the week grid, one cell per day. Each cell has three figures: sales on the left (with a small money icon), then labour cost, then labour percentage.
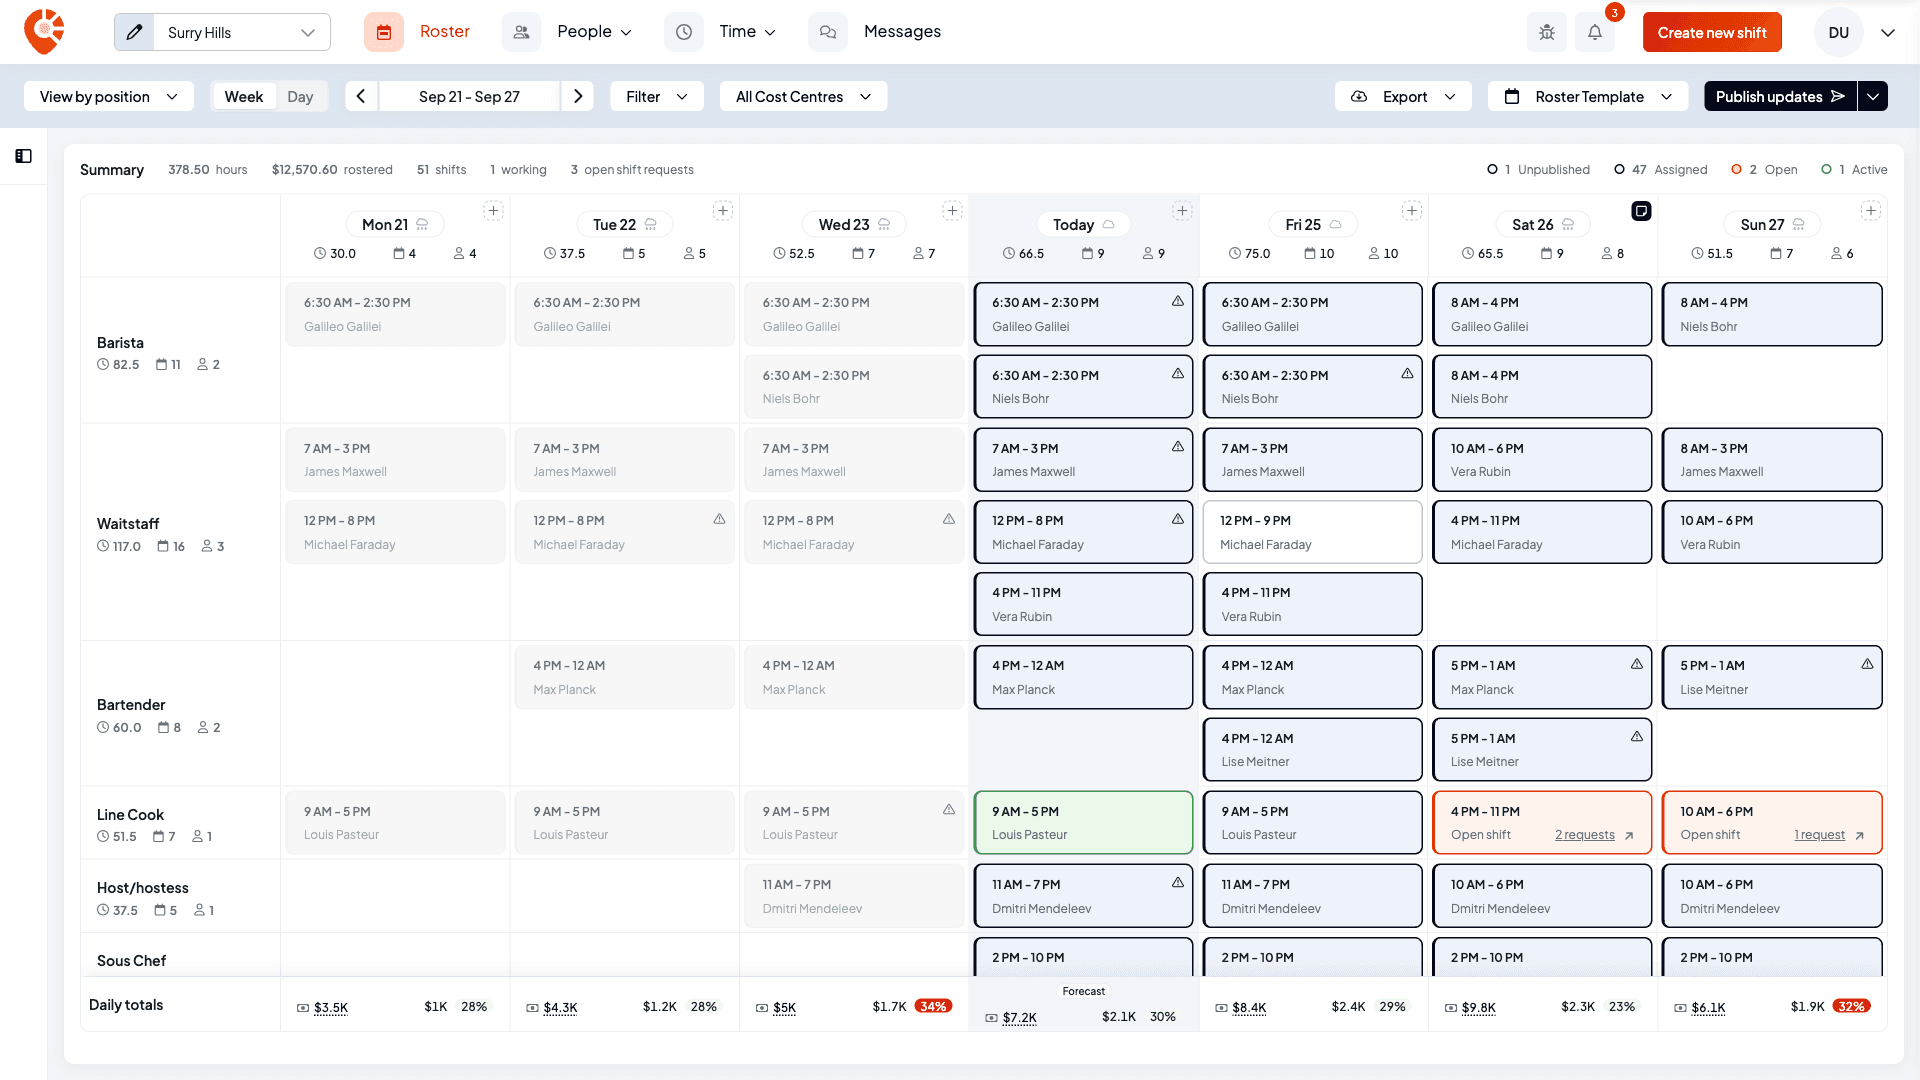
Which sales figure a day shows depends on the date:
- Future days show your sales forecast.
- Past days show actual sales. A past day with only a forecast shows no sales figure, and hovering it tells you what the forecast was.
- Today shows actual sales once you enter them. Until then it shows the forecast, with a Forecast tag above the cell.
A day with no figure shows $—.
Enter sales for a day
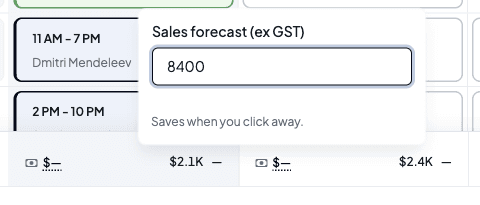
Enter a forecast
Click the sales figure (or $—) in a day's cell. For a future day, the box has one field, Sales forecast (ex GST). Type the amount you expect to take that day, not including GST.
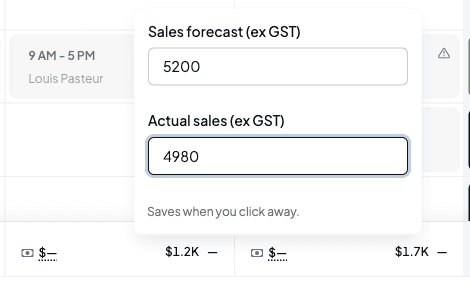
Enter actual sales
For today or an earlier day, the box also has Actual sales (ex GST). Type what you actually took. Once a past day has actual sales, the roster uses that figure instead of the forecast.
You can't record actual sales for a future day. Shiftly refuses with Actual sales can only be recorded for today or earlier.
Click away to save
The figures save when you click outside the box or press Enter. Press Escape to close it without saving. To remove a figure, clear the field and click away. If the save fails, you'll see Could not save. Your changes are still here. and the box stays open.
If your location's sales come in from Square, you don't need to type actual sales. Today shows the takings so far with a So far tag and the time they were last updated, and past days use Square's figure. To override a past day's figure, open its sales box and select Correct this figure. Clearing your correction goes back to Square's figure.
Read the labour percentage
Check the colour
The labour percentage is the day's labour cost divided by its sales. It shows in green when it's at or under the location's target, and in red when it's over. A day with no sales figure shows — instead.
Hover the percentage to see the working, for example Planned labour %: $1,927.63 of $6,100.00 forecast · over target (30%). Days measured against a forecast say Planned labour %.

Check what the labour cost is based on
Hover a day's labour cost to see where it comes from. For future days it's the rostered cost. For past days Shiftly uses each shift's timesheet where there is one and the rostered cost where there isn't, so the tooltip reads actual, from timesheets, part actual, part rostered or rostered, no timesheets.
The row only counts the shifts you can see, so clear any filters or job selection before you read it. See Find your way around the roster.
In the day view
In Day, the same figures sit in a rail at the bottom of the timeline, labelled with the day: Sales forecast (or Sales), Labour cost and Planned labour % (or Labour %). Click the sales figure to enter or change it, just like on the week grid.

Related
Find your way around the roster
Read the week grid, switch views and filter shifts.
Add and set up your locations
Set the target labour percentage for a location.
Sharing access
Choose which managers can see pay and sales figures.
Review and approve timesheets
Approve the timesheets that past days' labour cost is based on.
Add a note to a roster day
Leave a note on a day of the roster, such as a booking, a delivery or a staffing reminder, for the other managers at that location.
Publishing a roster
Send your drafted shifts to staff, choose who gets notified, publish a single shift or several weeks at once, and resend or clear a week.